

While standard deviation is indeed very useful in assessing investment risk, there are limitations to its use.
In analyzing any investment, smart investors factor in these potential weaknesses, including: asymmetric payoffs; historic versus future results; the need for context; human behavioural traits.
Awareness of these potential pitfalls will help you better incorporate standard deviation calculations in your own analysis.
Asymmetric Payoffs
In our previous discussion, we used examples with normal distributions. There was a reason for that. Standard deviations are poor tools for investments with asymmetric payoff profiles.
In a normal distribution, the payoff profile is symmetric. The normal distribution curve should look the same on both sides of the mean. Results should be equally disbursed around the middle. The tails on each end of the curve are symmetric. That is why one can use multiples of the standard deviation (e.g. 2 standard deviations from the mean contains 95% of all potential results) to determine outcome probabilities.
In an asymmetric profile, the distribution curve is skewed on one side of the mean or the other. By skewed, I mean that the tails are unequal in the distribution outcomes.
If the left side tail is more pronounced, there are more actual results to the right side of the mean. But a relatively few extremely small valued outliers drag the tail of the curve leftward. This is being “negatively skewed”.
If the right side of the curve is longer, there are more results on the left side of the mean. But a relatively small number of extremely high value outliers push the tail to the right. In this case, the distribution would be “positively skewed”.
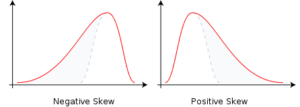
It is easy to see why skewed distributions limit the usefulness of the standard deviation as a risk measurement. In the graphs above, say the mean is 10 and the standard deviation is 2. Under a normal distribution, 68% of results should lie between 8 and 12. 95% of outcomes between 6 and 14. But, as you can see in these two graphs, the distribution pattern is not symmetric. So it is unlikely that the results will fall in the range as intended for standard deviation to be helpful in analyzing the investment.
In the real world, positively skewed distributions are more common than negative ones.
A Real-Life Example of Skewed Distributions
Employee compensation is a typical example. You have 100 people in a company and the average, or mean, salary is $50,000. Of the 100 staff, most likely earn close to that $50,000. Some will make less than the average. But even the most junior staff will earn a minimum level, perhaps $10,000 to $20,000. That is the tail on the left side of the curve.
If compensation was normally distributed one would expect senior management to receive approximately $80,000 to $90,000. A similar “distance” from the mean as the lower junior staff. That creates a nice symmetric, bell shaped curve.
In reality, the President and direct subordinates may earn substantially more. In this example, say the President earns $325,000 and the three Vice-Presidents earn $225,000 each.
Senior management is very few in number, but they distort the distribution curve in two ways.
One, total compensation is $5 million (100 staff averaging $50,000 each), yet only 4% of all employees earn 20% of the compensation (4 senior staff make $1 million combined). That inflates the overall mean relative to the typical employee.
If you eliminated those 4 from the calculation, there would be 96 staff earning $4 million. This results in an adjusted mean of only $41,667 for non-senior management employees. Probably a more realistic figure to compare employee averages. Most staff will earn closer to this average.
Two, the very small number of extremely high value earnings will lie on the far right side of the distribution. These salaries push the curve much farther to the right than if all compensation was normally distributed. The average will be further right than the peak of the curve. This results in the long right-hand tail and the positive skewing of the distribution.
You can likely think of many more examples of where outcomes are not symmetric in reality.
In the realm of investing, option strategies and portfolio insurance are examples of asymmetric payoff profiles.
Not areas we shall delve too deeply. However, I wanted to properly explain asymmetric distributions to further reinforce the understanding of normal distributions.
The Past is Not the Future
A second issue with standard deviations is their use of historic data. Past results might be a predictor of the future, but results may also change over time.
New management, different product lines, increased competition, expiration of patents, etc., all may impact future results and therefore alter the standard deviation.
Be careful in placing too much faith in historic results.
Standard Deviations Need a Context
Standard deviations should never be considered on their own. One needs to factor in the expected return as well.
For example, investment A has a standard deviation of 6%. Investment B has a standard deviation of 10%. If you only look at the standard deviation, B is the riskier investment.
But what if I also tell you that the expected return for A is 4% and 15% for B?
At a 95% confidence interval below the expected return, you could actually lose more with investment A than B. Without getting into the calculations, you could lose 5.9% with A and only lose 1.5% with B.
To address this issue, you need to consider the concept of “Value at Risk”. We may or may not get into this slightly more complex topic at a later date. But no promises or threats.
Human Behaviour
Standard deviations are unable to quantify behavioural aspects of investing risk.
We will devote some time to Behavioural Risk issues at a later date. In essence, it looks at how human behaviour affects the investing decision-making process .
It is an interesting and important topic. And it will not put you to sleep.
So there is a quick overview on the limitations of standard deviations as a risk measure.
You will not need to calculate means or standard deviations. But it is important to know what they are and why they are useful. Then, when you do encounter them, you understand the value and limitations of both measurements.
