

Today we begin to look at investment risk in greater detail.
This expands on our preliminary discussion in Defining Investment Risk.
Investment Risk Revisited
Previously we defined investment risk as a speculative risk. As such, investment risks provide the possibility of incurring a loss, breaking even, or profiting. This differs from pure risks where you cannot profit from the risk.
I wrote that investment risk is the probability that the actual returns on an investment will differ from the expected returns. The higher the probability of a different result, the greater the risk. The lower the probability of a different result (or the greater the certainty of the same result), the lower the risk.
That may mean a loss like with a pure risk. A gain, but less than was expected. Or it could mean a bigger return than anticipated. So a risk, yes. But one that may bring rewards.
Investment risk is simply the level of volatility of returns. Not a risk of loss. Important to remember.
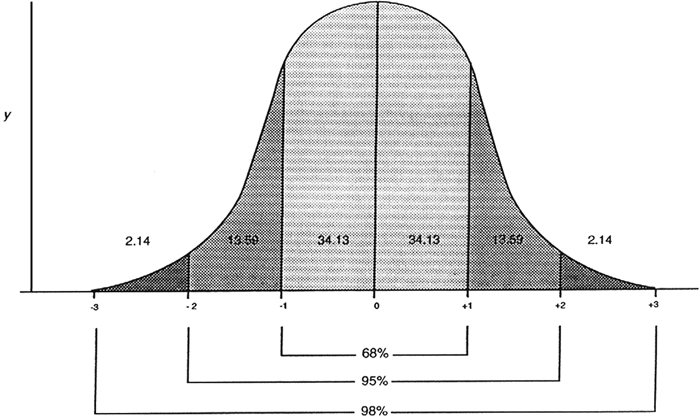
Investment Risk in a Graph
For those of you poor souls who have taken statistics courses, investment risk is typically viewed from a normal distribution perspective. The graph below is an example of a normal distribution curve.
Not the easiest concept to explain in a blog post (augmented by the fact that I am not a statistics professor), so we shall try and keep this basic.
Outside of a few key concepts, I intend to keep the statistics and formulae at a minimum. Not fun to read, nor usually necessary to understand the principles. But I think it worthwhile for risk as it is calculated via standard deviations.
Like head-ache medication though, I caution you not to read this post while driving or operating heavy equipment. The following may just put you to sleep.
Normal Distribution
You may also recognize the graph above as a Bell curve, so named for its shape. Or you may have heard it called a Gaussian distribution; named after Carl Friedrich Gauss.
Within a normal distribution, historic outcomes are placed on the graph and a distribution similar to the one above typically results.
The “Y” axis represents the actual outcomes. The more results at a certain level, the higher the curve. The bottom “X” axis represents the distance from the average (i.e. mean) result.
It is called normal because the outcomes are symmetric in nature. You can see this by the equal spread of outcomes on both sides of the curve. Note how the tails on both the left and right sides of the curve are similar in distribution.
If the distribution was not normal, but rather skewed, one end of the curve would be longer and more pronounced than the other end.
The important thing to note with a normal distribution is the way the Bell curve looks. Most of the actual results cluster relatively close to the middle of graph. The higher the curve, the more results are at that level. As you move farther from the middle, the number of results decreases. This creates the diminishing tails at either end.
In the real world, normal distributions are common. For example, the average height of US men is 5’10”. Most American men are roughly this height. The proportion taller or shorter will continue to diminish as you move away from this average.
And it should make sense that the larger the sample size, the more appropriate the results. If you sample 3 men, you may not find an average of 5’10”. If you sample 300,000, you will get a realistic average. The same holds true with investing. The smaller the sample size or time period, the more questionable the result.
Mean
In investing, the mean is the expected return on the investment. This is represented by the average result on the above normal distribution curve, located at position 0.
The expected return may be calculated based on historical data, theoretical probability models, experience, and professional judgement. Perhaps the expected return will be 2%, 12%, 22%, etc. The 0 midpoint on the Bell curve simply represents the consensus expected return.
As most investments carry risk, actual results may differ from expected outcomes. Actual results usually lie somewhere to the left or right of the expected return. That said, there is no reason that they cannot fall exactly on the mean.
Note that you may encounter “median” as an average. It is not. A median return is one that simply takes all values, sorts them in ascending order, and determines the middle value. For example, you have 5 returns. 3, 4, 5, 16, 22. Median just puts the numbers in order and finds the midpoint. In this example, 5. There are 2 outcomes to the left, 2 to the right.
Calculating the arithmetic mean, you add up all the values and divide by the number of outcomes. In this example, the arithmetic mean is 10. Significantly different than the median.
And no, do not use median to assess investments. Median has some value, but use mean if possible.
Note that arithmetic means often have their own flaws. We will explore those and the use of geometric means later.
Investment Risk
So we know that the expected return of an investment is the mean, or average, in a normal distribution. We also know that the actual results will fall on either side of the mean.
But what does that tell us about the investment risk?
The investment risk is the variability of the actual returns around the mean. In English, simply how far away from the average return is the actual result. The average is 0, the high point on curve.
As you can see above, actual results may be both greater or less than the expected return. So investment risk applies to the possibility of higher than expected returns, not simply lower than expected ones. However, investors are usually more concerned with results to the left of the curve. That is, where the actual performance is less than the expected returns.
The risk of an investment is determined by the variability, also known as volatility, of the actual returns around the expected return. Volatility is the amount of fluctuation in the actual returns from the expected returns. The greater the degree of volatility, the greater the risk of the investment.
The tighter the probability distribution of the expected future returns around the mean, the greater the certainty of the returns. As the certainty of the return increases (i.e. the less potential difference between the actual and expected result), the smaller the amount of uncertainty or risk. In a normal distribution curve, the vast majority of actual results would amass extremely close to the mean. The bell would be quite high and narrow in width.
For results with high variability, the actual returns would be disbursed much farther from the mean. This would cause the bell shape to be shorter in height and much wider in width.
An Example of Investment Risk
For example, investment “A” has an expected return of 5% and the actual returns over the last 6 years were 4%, 6%, 5%, 5%, 6%, 4%. The distribution around the 5% mean is quite tight. You would be right to expect the return over the next year to be close to the expected outcome. The risk that the return will not be close to 5% is low.
Investment “B” also has an expected return of 5%. However, its performance for the last 6 years was 2%, 12%, -4%, 15%, -3%, 8%. The actual results are significantly different from the expected result. You should be concerned that the actual result for the upcoming year will not be close to the expected return of 5%.
Here you have two investments with the same expected return. Yet the certainty of earning 5% on A is pretty high for next year while there is very little guarantee as to what B returns. It may be 5%. Or it may be significantly different than 5%. Even experiencing a loss. A’s expected future return is pretty certain. B’s expected return will be very volatile.
That is investment risk.
So how does one differentiate between the two investments?
